Covid-19 Regional Dashboard
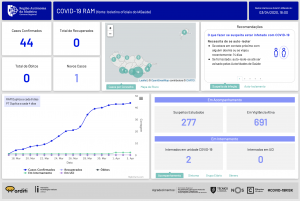
The Covid-19 regional dashboard is a web application developed to visualize data about the Covid-19 pandemic at the regional level in a responsible and visually coherent way. Developed by researchers from ITI / LARSyS this project was donated to the regional health authorities of Madeira integrating risk maps and health recommendations. The visualisations designed by ITI Design PhD Student Marta Ferreira and implemented by Miguel Ribeiro another ITI CS PhD student follow the design guidelines of responsible visualisation of health critical information (e.g. the use of neutral colours) and intend to provide regional authorities with a baseline to evolve the communication of this sensible data to the wider population. A decision support dashboard was also developed for the health authorities integrating higher resolution spatial information provided by NOS telecom and also predictions about the potential spread of the virus by other projects like COVID-19RISK and CERENA‘s geostatistical model.
The goal of this project is to evolve the dashboard supporting the transition to opening of containment measures where informing people and mitigating risk is going to be even more important. Next steps are including mobility information to support social distance and mapping potential social/demographic risks for this the research team is looking for potential partners that could help integrate other sources of data for authorities. The dashboard is also available to be adapted to other regions. Contact us if you’re interested.
Keywords
Information visualization, human-computer interaction, Covid19 risk maps.
Associated Users
Location
The initial prototype is implemented for the Health authorities of the Autonomous Region of Madeira.
Entities
Instituto Superior Técnico, Universidade de Lisboa, Instituto de Tecnologias Interactivas, IASaude.
0 Comments